Grunt loves data. At a very deep level Grunt understands that data is dynamic - that it can change, rearrange, grow and shrink. Unfortunately, most presentations are created using objects that are agnostic about the data they contain and represent. Once the data changes, this agnosticism starts working against you. Anyone who's spent time creating and maintaining presentations knows this to be the case; once your data changes you can end up wasting hours readjusting your design. Grunt exists to solve that problem.
Rules
Every design choice in Grunt can be made with a rule. In essence, a rule is a really powerful form of conditional formatting. Rules can be applied to almost anything, even to other rules. That way, you can compose rich and dynamic visualizations that are reactive to changes in your data. It's much faster than moving boxes and lines them around in PowerPoint, and it's certainly faster to update.
Read more about getting started with rules here.
Your first Grunt
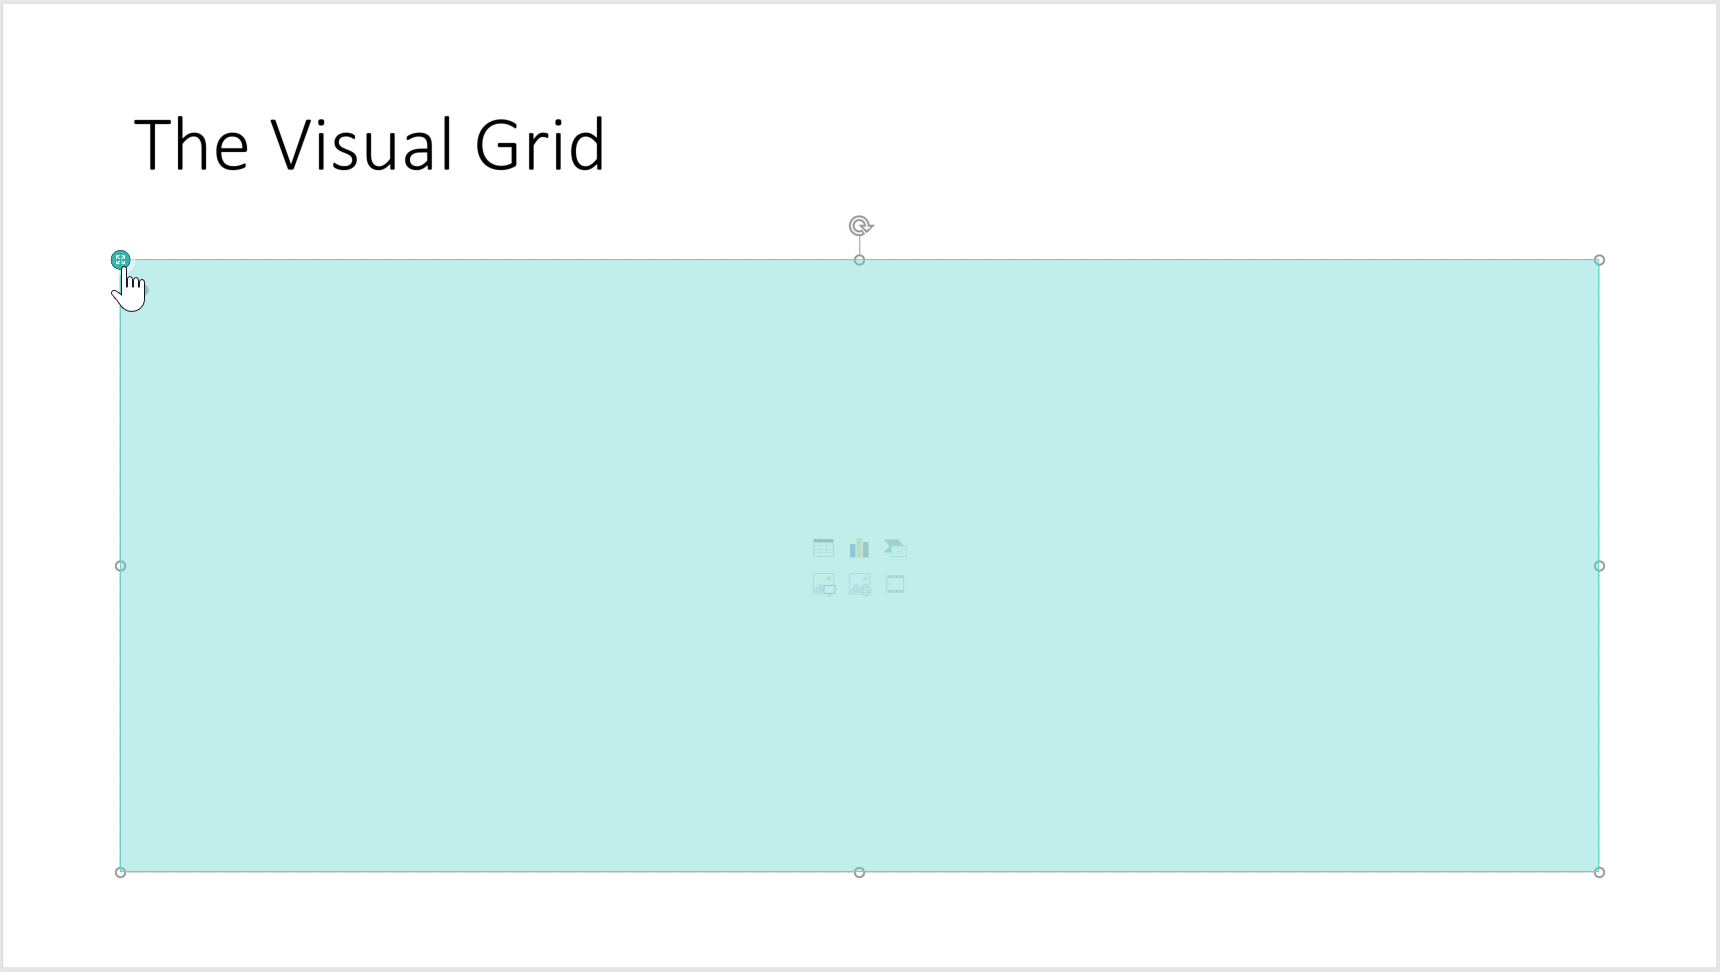
The Visual Grid is the main workhorse in Grunt. It's incredibly versatile - it can be a single chart, or it can hold shapes with text, or a combination of charts, shapes, and text in a single object. With the Visual Grid, you can easily achieve great layouts and visualizations that blend text, charts, icons, shapes and images in a single rule-based object.
You can get the data for your Visual Grid either from an external data source such as Excel – or it can be typed in directly in PowerPoint. We will now take a closer look at how to create a Visual Grid with data directly typed into PowerPoint. If you want to copy your data from Excel, read this support article on how to link to data from Excel.
Creating a Visual Grid with embedded data
The simplest way to create a Visual Grid in Grunt is to insert an empty grid.
Go to the Grunt tab and choose Visual Grid. You can now select the number of rows and columns you'd like. Don't worry too much about getting it right - you can easily add or remove columns and rows later. If you prefer to start with some kind of layout, select one of the available styles. We will continue this walkthrough with a plain Visual Grid.
Adjust the size of the object and place it somewhere on your slide. If you want the Visual Grid to fit an empty content placeholder, click on the icon in the top left corner of the placeholder.
You should now have something that looks like this:
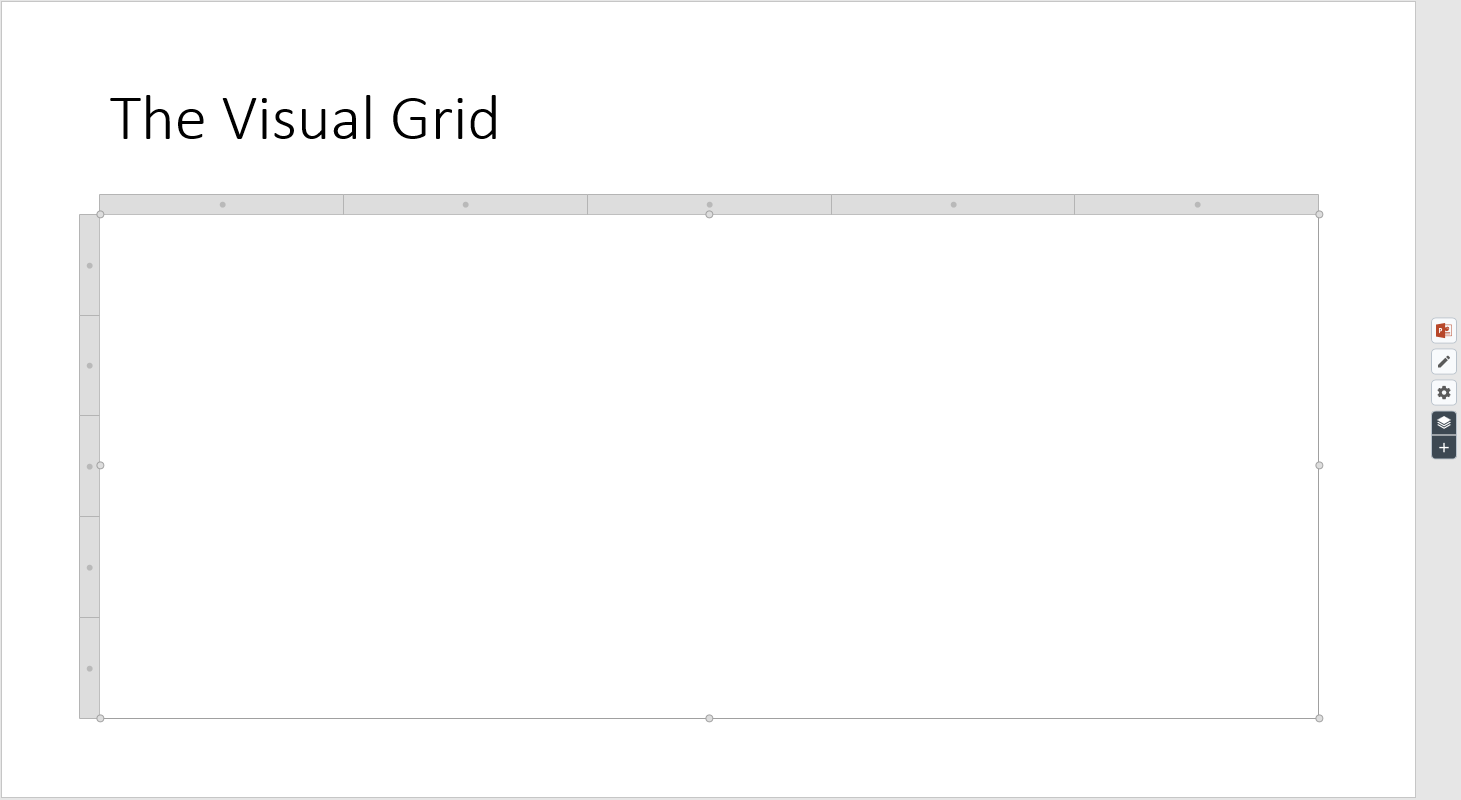
As you can see, the grid is empty. We'll deal with that shortly, but let's first take a closer look at what you can currently see. When your grid is selected, some buttons show up all the way to the right in the slide view.
 - Edit Visual Grid data (F3 hotkey)
Clicking the "Edit Visual Grid" button (or the F3 hotkey on your keyboard) opens up a spreadsheet where you can edit the data in your Visual Grid. The spreadsheet is "live", meaning that any values you enter in the spreadsheet will automatically update in the Visual Grid once you commit them (by pressing Enter or Tab).
 - Rule Stack
The Rule Stack is where your design rules will show up when you start adding them. You can add one by clicking the + icon at the bottom, or you can use the hotkeys CTRL + Enter.
The rule-stack works like a physical stack of objects, meaning that when you add rules, you stack them on top of each other. Rules are applied by Grunt bottom-up so that rules further to the top may "overwrite" those further down. We'll take an in-depth look at rules and the rule stack later.
Read more about rules here.